Quantitative Risk Management: How Quant Traders Think

Quantitative Risk Management: How Quant Traders Think
Imagine seeing an equity curve with a 99% win rate, a line that climbs so smoothly it looks drawn with a ruler. How should a quant trader feel about that?
That question is the entire discipline of quantitative risk management in miniature. Quant investors don’t start by asking what a strategy returned. They start by asking what it risked to get there, what it would have lost under conditions that haven’t happened yet, and whether ten days of anything means anything at all. Returns are the output. Risk is the input you can actually control.
Here’s how that mindset works in practice.
What Quantitative Risk Management Actually Means
Quantitative risk management is the practice of measuring potential loss in advance and writing rules that constrain it — before any capital is at stake.
The word “quantitative” matters. It means the limits are numbers, not feelings. Instead of “I’ll cut this if it gets bad,” the rule reads “close the position at a 2% account loss.” Instead of “this looks like a big opportunity,” the rule reads “no single position exceeds 5% of capital.”
This isn’t a claim that rules produce better outcomes than judgement. It’s a difference in where the decision happens. Discretionary traders decide in the moment, with money on the line. Systematic traders decide beforehand, in writing, when nothing is at stake and thinking is clearer. Both face the same markets and the same losses.
Algorithmic Trading Risk Management Starts Before the First Trade
In algorithmic trading risk management, every rule has to be specified in advance because code can’t improvise. That constraint turns out to be the point.
A complete rule set answers four questions before deployment:
Entry — what conditions trigger a position
Exit — what closes it, in profit and in loss
Sizing — how much capital each position gets
Stop conditions — what shuts the whole system down
Most blown accounts trace back to the second and fourth items. A strategy that only defines profitable exits will show beautiful closed-trade statistics while losses accumulate in positions that never close. The curve looks perfect because the losses aren’t on it yet.
How Quants Manage Risk Differently From Discretionary Traders
The difference isn’t sophistication — it’s timing and documentation. Quant risk management commits to limits before exposure begins, records them, and then measures whether they were followed.
That last part is underrated. A rule you override is not a rule. Systematic approaches make overrides visible, because the system did one thing and you did another, and the log shows it.
The Three Numbers Quants Watch
Most of quant risk management reduces to three measurements.
Maximum Drawdown
Maximum drawdown is the largest peak-to-trough decline an account experiences. It answers the only question that matters during a bad stretch: how far down did this go before it came back?
The math is asymmetric and unforgiving. A 20% loss requires a 25% gain to break even. A 50% loss requires 100%. A 90% loss requires 900%. Losses compound against you faster than gains compound for you, which is why quants treat drawdown as a hard constraint rather than a statistic to report afterward.
Drawdown also has a psychological dimension no formula captures. A limit you accept in a spreadsheet is a different experience when it’s your account balance on a Tuesday morning.
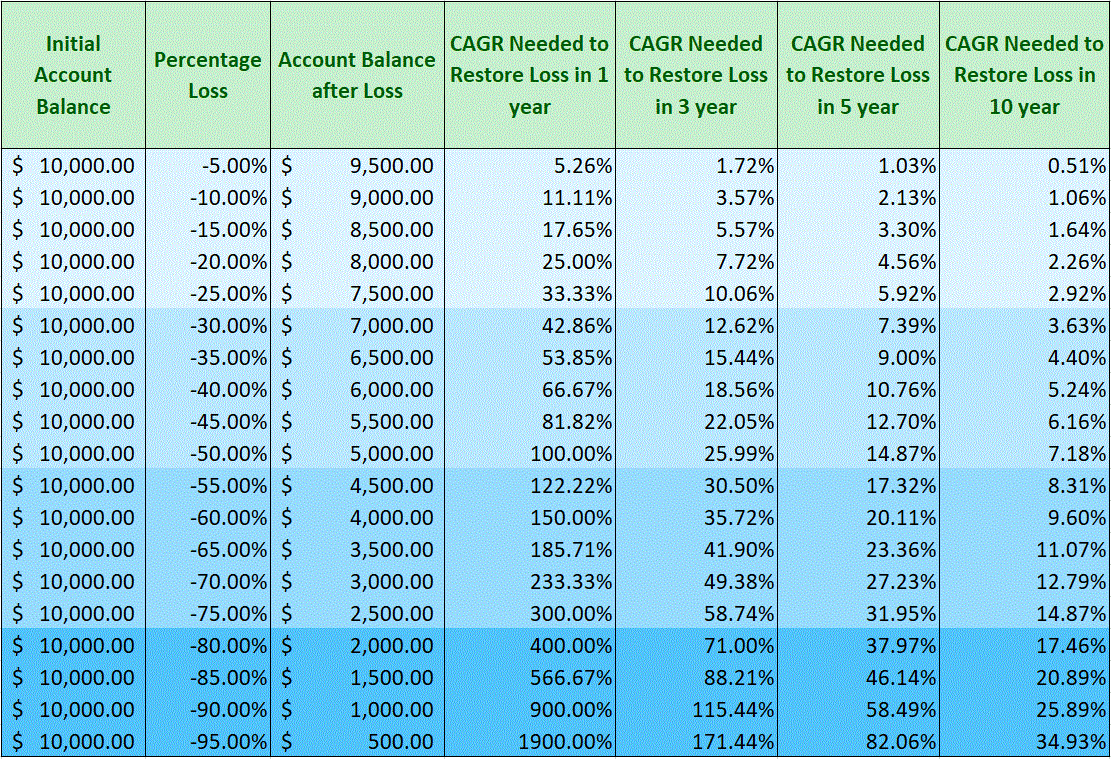
Source: Fama/French Data Library (Kenneth R. French / Eugene F. Fama) - Author: X and Y Advisors, Inc.
Position Sizing
Position sizing determines how much capital any single idea receives. It has more influence on survival than entry timing does.
The logic is simple: if no position can lose more than a small fraction of the account, no single position can end you. Size positions so that being wrong is survivable and being wrong repeatedly is still survivable. Common approaches fix the percentage of capital at risk per trade, or scale size inversely to an instrument’s volatility.
Sizing is also where leverage enters. Leverage doesn’t change whether you’re right — it changes how much being wrong costs.
Risk-Adjusted Returns
Risk-adjusted returns describe a family of measures that weigh outcomes against the variability taken to get them. The Sharpe ratio is the most cited: return above the risk-free rate, divided by volatility.
What these measures capture is that two identical returns aren’t equivalent if one came with wild swings. What they miss is just as important. Volatility-based measures treat upside and downside swings the same, assume returns are roughly normally distributed, and can look excellent right up until a rare event that the sample period never contained.
Where Risk Hides
Strategies rarely fail where their metrics are looking. The recurring blind spots:
Open positions. Closed-trade statistics exclude floating losses, or unrealized losses. Always ask what the curve looks like including unrealised P&L.
Sample size. Ten days and 200 trades is a sample small enough that luck dominates. Meaningful conclusions need far more observations across varied conditions.
Overfitting. Test enough parameter combinations against past data and something will fit beautifully. That’s just the probability of backtest overfitting. Historical fit is not predictive power.
Regime dependence. Nearly everything works in a sustained bull market. A strategy that hasn’t traded through a drawdown has not been tested.
Tail risk. The rare, severe event. Strategies that win constantly by refusing to realise losses are most exposed here — they work until a single move undoes every prior gain.
Building Trading Risk Management Strategies You’ll Actually Follow
Trading risk management strategies fail more often from abandonment than from bad design. To reduce that:
Write limits down before deploying capital — drawdown ceiling, per-position size, total exposure.
Set the shutdown rule explicitly — the loss level at which the system stops, decided in advance.
Track adherence, not just performance — log every override.
Review on a schedule, not after losses — changes made mid-drawdown are usually emotional.
Quantitative risk management is less about prediction than about surviving being wrong, repeatedly, without being removed from the game. That’s the actual edge — staying solvent long enough for a process to matter.
Frequently Asked Questions
What is quantitative risk management in trading?
Quantitative risk management is the practice of measuring potential loss in advance and setting numerical limits — position size, drawdown ceilings, stop conditions — before capital is deployed. The limits are rules, not judgement calls made mid-trade.
How do quants manage risk differently from other investors?
Quant risk management commits to written limits before exposure begins, then measures whether those limits were actually followed. The difference is timing and documentation rather than sophistication — decisions are made when nothing is at stake.
What is maximum drawdown and why does it matter?
Maximum drawdown is the largest peak-to-trough decline an account experiences. It matters because recovery math is asymmetric: a 50% loss requires a 100% gain to break even, and a 90% loss requires 900%.
How does position sizing reduce risk?
Position sizing caps how much capital any single idea receives, so no one position can end the account. It influences survival more than entry timing does, and it’s where leverage decisions get made.
Are risk-adjusted returns a reliable measure of a strategy?
Risk-adjusted returns weigh outcomes against the variability taken to reach them, but volatility-based measures treat upside and downside swings identically and assume roughly normal distributions. They can look strong until a tail risk event the sample period never contained.
How many trades does it take to know if a strategy works?
Far more than most published results show. A short sample across a single market regime is dominated by luck — meaningful conclusions need many observations spanning varied conditions, including drawdowns.
This content is educational and general. It is not investment, legal, or tax advice, is not a recommendation to buy or sell any security, and does not consider your individual circumstances. Any securities or strategies mentioned are illustrative only. Consult a qualified professional about your situation.

Other blogs