Quant Strategy Overfitting: How to Spot It Early
Quant Strategy Overfitting: How to Spot It Early
If you’ve tried your hand in quant strategies, you may know all too well about what can happen when a rule set produces an excellent historical result. It gets deployed, and within weeks, live results look nothing like the simulation.
The strategy here isn’t necessarily broken, but it was never really working. This is because it had memorised one particular stretch of market history.
That gap between backtest and reality is usually quant strategy overfitting, and it is the most common reason a systematic approach disappoints the person who built it. The good news is that it leaves fingerprints. Most of them can be checked before a single dollar is committed. Here is what to look for, why it happens, and what the standard defences actually accomplish.
What Quant Strategy Overfitting Actually Means
Every price series contains two things:
durable relationships that might repeat, and
noise that will not.
A rule that captures the first generalises. A rule that captures the second describes one specific past and nothing more.
Quant strategy overfitting is what happens when a model learns the noise. The rules keep getting refined until they fit the tested period closely — and the closer that fit gets, the more of it is built on coincidence. The strategy ends up describing history rather than explaining it.
Why It’s Also Called Curve Fitting Trading
Practitioners often use the older term, curve fitting trading, and it is the more visual of the two. Picture bending a line until it passes through every point on a chart. It now matches those points perfectly. It also has no predictive value whatsoever, because it was shaped by the points rather than by anything underneath them.
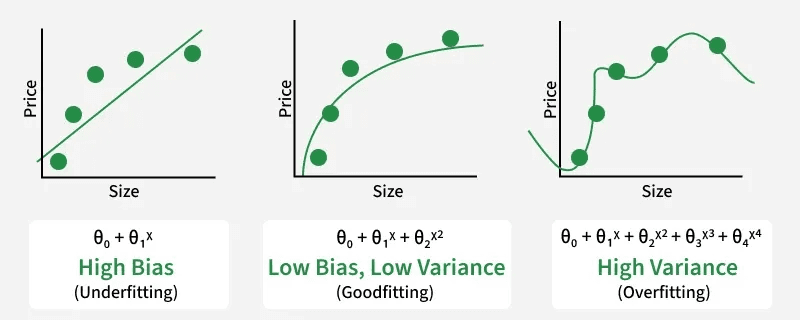
Image source: GeeksforGeeks
Six Signs of Overfitting You Can Check Yourself
These signs of overfitting don’t require advanced statistics. Each is a question you can answer about a strategy in a few minutes.
The historical equity curve looks unusually smooth. Real strategies have ugly stretches. A result with almost no rough patches usually means the rules were adjusted until the rough patches disappeared.
There are many parameters relative to the number of trades. A rule with eight tunable inputs tested across forty trades has far too much freedom. As a rough discipline, the fewer moving parts per observation, the more trustworthy the result.
Small parameter changes break it. Shift a lookback window from 50 days to 55. If results collapse, the strategy found one lucky setting rather than a robust effect. Stable ideas degrade gradually.
There’s no economic reason the rule should work. Any effect worth trading should have an explanation: a behavioural bias, a structural constraint, a liquidity dynamic. “The data says so” is not an explanation.
The test period is short or covers one regime. A strategy tested only through a sustained bull market has been tested against one set of conditions, not against markets in general.
It was chosen from many variants. Test fifty ideas and a few will look excellent by chance alone. If this strategy is the survivor of a large search, its track record includes the luck of the selection process.
What an Overfitting Backtest Can and Can’t Tell You
An overfitting backtest isn’t a coding error. It is an evidence problem, and treating it that way changes how much weight a simulation deserves.
A backtest can tell you that an idea would not have worked — that is genuinely useful, and it is the cleanest thing historical testing does. It can also show how a strategy behaves under stress, what its worst stretches looked like, and how sensitive it is to assumptions about costs.
What it cannot do is prove an idea will work. It is a filter, not a verdict. The distinction matters, because backtest overfitting tends to take hold precisely when someone starts treating simulated results as confirmation rather than as one weak piece of evidence.
How Parameter Optimization Creates the Problem
Parameter optimization is where most of the damage originates. Each tunable input — a threshold, a window length, a rebalancing interval — is another dimension in which the rules can be bent toward the sample.
Search a grid of a thousand combinations and an excellent-looking result almost certainly exists inside it. Finding it is not discovery. It is the predictable outcome of looking hard enough at a fixed dataset.
Extra-Sample Testing: The Standard Defence
The main defence is out-of-sample testing: hold back a portion of the data, build and tune entirely on the rest, then run the finished rules on the untouched portion once.
The word “once” is doing the work. If results disappoint and the strategy gets adjusted and retested on the same holdout, that data is no longer out of sample. It has become part of the development set, and the protection is gone. The structure below shows how the split works in practice.
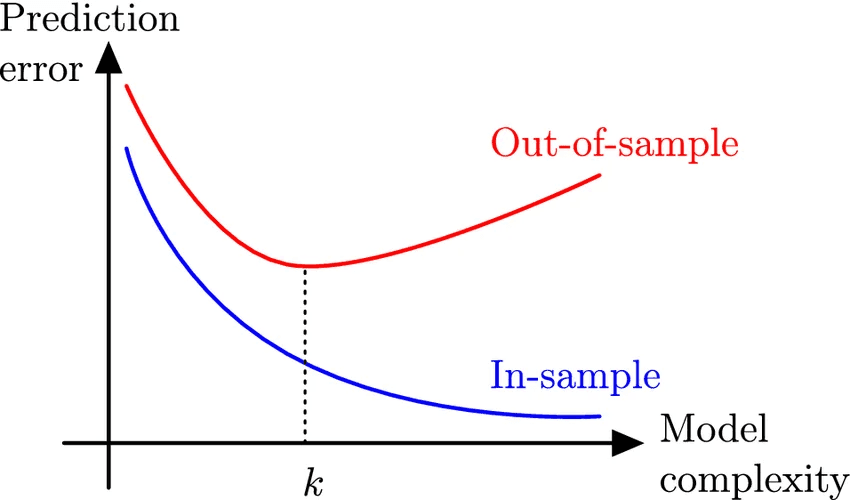
Source: Comparison of Jackknife and Hybrid-Boost Model Averaging to Predict Surgery Durations: A Case Study by K. W. Soh, Cameron G. Walker, Michael O'Sullivan, and J. Wallace, published in SN Computer Science (Nov 2020), via ResearchGate.
Where Walk-Forward Analysis Fits In
Walk-forward analysis extends the idea. Optimise on one window, test on the window that follows, then roll both forward and repeat across the full history. The diagram below shows the rolling structure.
The result better approximates how a strategy would actually have been run — with decisions made using only information available at the time. It is more demanding to implement, and results are typically less flattering than a single in-sample fit. That is the point.
Questions to Ask About Any Strategy You Didn’t Build
The same scrutiny applies when evaluating someone else’s work. How long is the test period, and which market conditions does it cover? How many parameters does the strategy carry? How many variations were tested before this one was presented? Were results measured after realistic costs? Reluctance to answer is itself informative.
The Honest Limit
No procedure eliminates the problem entirely. Anyone building a strategy has already seen the data, and that knowledge influences every choice made afterwards — which markets to test, which ideas to try, when to stop refining. Some degree of fitting to the past is unavoidable.
The realistic goal is reducing the odds: fewer parameters, longer and more varied test periods, a reason the effect should exist, and genuine restraint with holdout data. Combined with modest expectations about what any simulation proves, that is about as far as the discipline goes — and it is considerably further than most people get.
Frequently Asked Questions
What is quant strategy overfitting?
Quant strategy overfitting is when a model learns the random noise in historical data instead of a durable relationship. It looks excellent on past data and disappoints afterwards.
How do you know if a backtest is overfit?
The clearest signs of overfitting are an unusually smooth equity curve, many parameters relative to the number of trades, and results that collapse when a setting is nudged slightly. An overfitting backtest also tends to lack any economic reason the rule should work.
What is the difference between overfitting and curve fitting trading?
They describe the same problem — curve fitting trading is simply the older, more visual term used by practitioners. Both refer to rules shaped to match one specific price history rather than a repeatable effect.
How does out-of-sample testing prevent overfitting?
Out-of-sample testing holds back data the strategy never saw during development, then runs the finished rules on it once. It only works if that holdout stays untouched — retesting it after adjustments removes the protection.
Why is walk-forward analysis better than a single backtest?
Walk-forward analysis optimises on one window and tests on the next, rolling forward through history, so decisions use only information available at the time. It is more demanding than a single fit and usually produces less flattering results.
This content is educational and general. It is not investment, legal, or tax advice, is not a recommendation to buy or sell any security, and does not consider your individual circumstances. Any securities or strategies mentioned are illustrative only. Consult a qualified professional about your situation.

Other blogs
